Understand your OR performance to drive efficiency
- See utilization, capacity and key performance trends
- Identify delays, variation and opportunities to target improvement efforts
- Track performance to support surgical planning and resource allocation
See where OR time and capacity are being lost
Low effective utilization
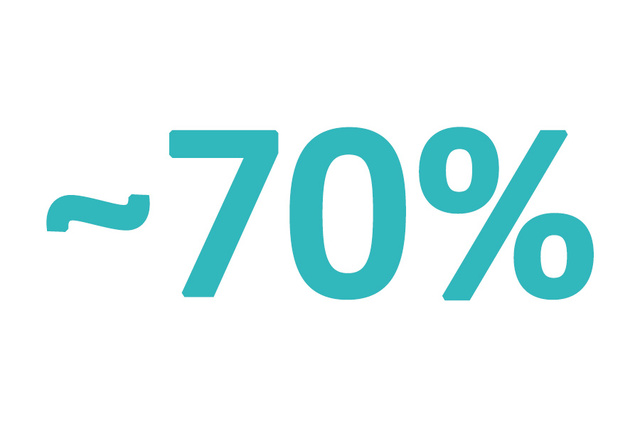
Studies report OR utilization at around 70%.[1] Unused capacity can limit how effectively available OR resources and time are used.
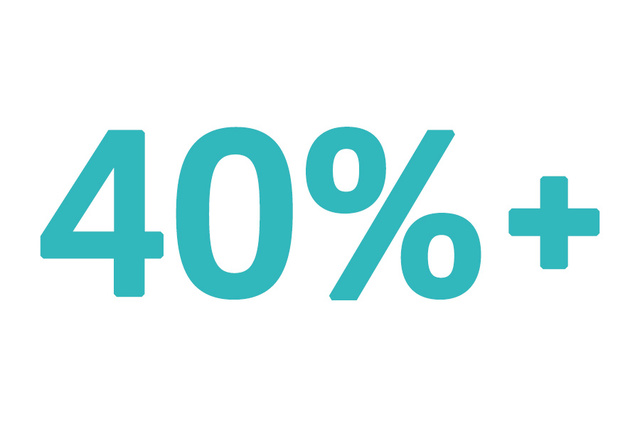
Late first-case starts
In 6 of 7 studies, over 40% of first cases started late at baseline.[2] Delays can disrupt the rest of the surgical schedule.
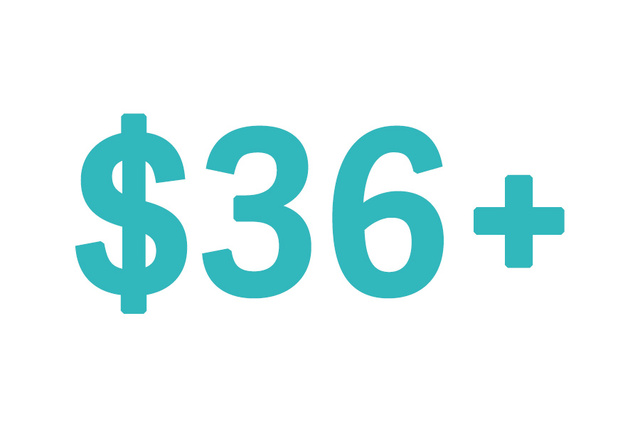
Costly idle minutes
Every unused OR minute costs 36$. [3] Even small inefficiencies can add up when valuable OR time is lost.
See your OR data. Improve how it runs.
Torin Analytics brings your OR performance data together for easy reporting and analysis. Intuitive dashboards give you a clear view of KPIs and trends, helping you identify opportunities for improvement without relying on time-consuming manual reporting.
Turn OR performance data into measurable improvement
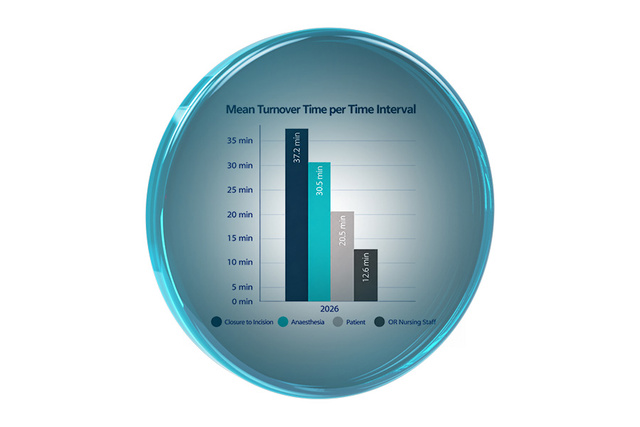
See performance clearly
Get a view of OR capacity
Bring utilization, turnover, delays and on-time starts into one clear view. Compare performance across rooms and time periods to see where capacity may be underused.
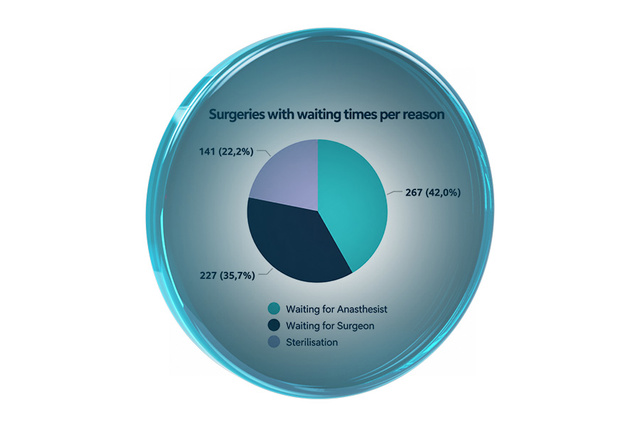
Understand what drives it
Find where time is lost
xplore patterns across rooms, specialties and procedures to understand where bottlenecks and variation occur. Drill into the data to see where performance differs.
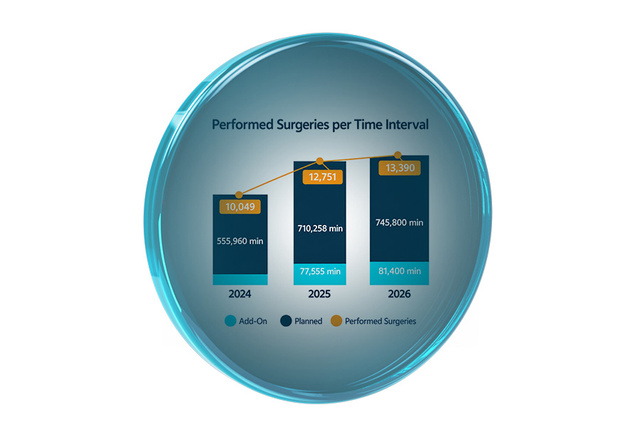
Act and track improvements
Turn insights into targeted action
Take action based on the patterns you identify and track performance over time. See whether changes are making a measurable difference.
The full view at your fingertips
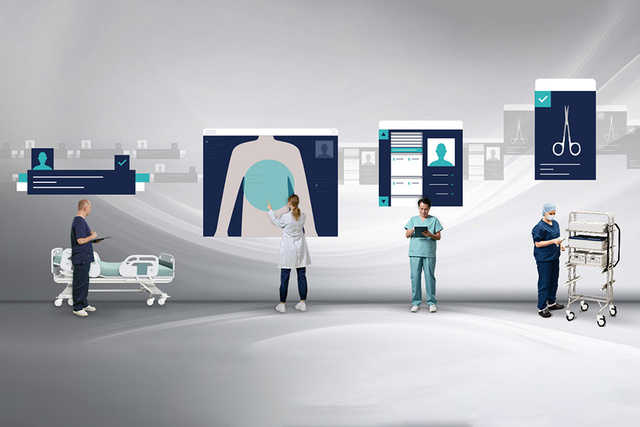
A digital ecosystem for your perioperative workflow
With seamless integration and reliable communication, Getinge Digital Health Solutions collects and structures data optimizing your hospital workflows.
It saves time, increases staff satisfaction, and comprehensively optimizes health care workflows to improve care quality.
Designed by MedTech experts and compatible with EMR systems, our proven suite of software provides a touch of clarity.
Related products
Move from assumptions to clear data-backed decisions
No more pulling data from three systems or building spreadsheets to answer questions the dashboard already has. Patterns are identified, root causes are visible, and your team can act on them today instead of investigating for weeks.
How well are you utilizing your OR rooms?
Support better capacity planning
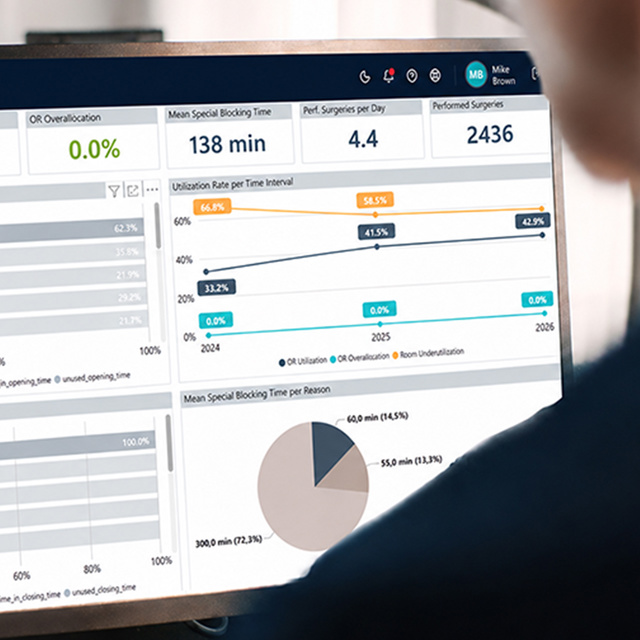
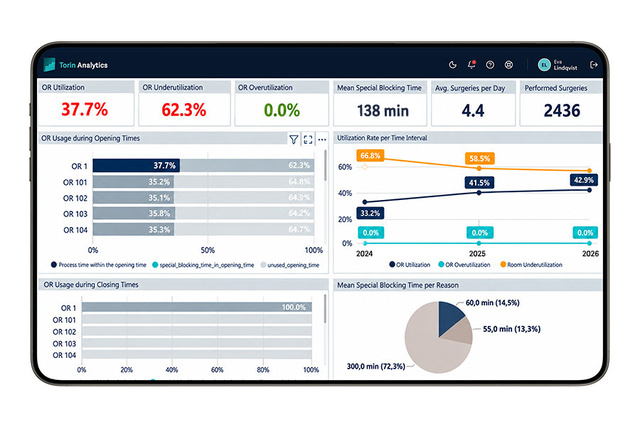
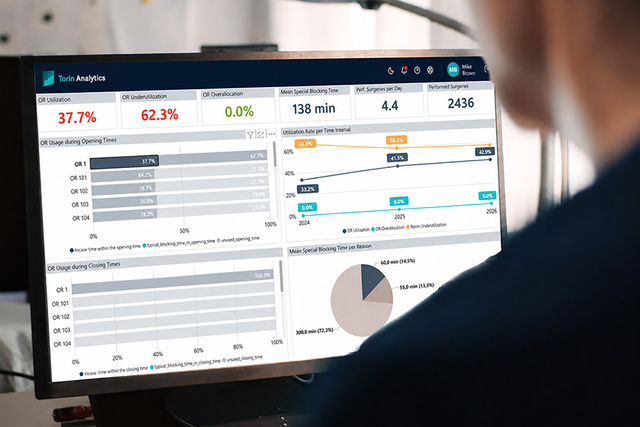
See how each OR spends its time, measured by patient-in-room or full room-occupied time including cleaning. Color-coded KPIs show utilization, underutilization and overutilization, helping you identify where time is unused or activity extends beyond planned hours.
- Room-by-room breakdown of active procedures, blocking time and unused time
- Track trends from yearly down to daily to identify recurring patterns
- Choose the metric that fits your question: column time or room-occupied time
What is actually happening between surgical cases?
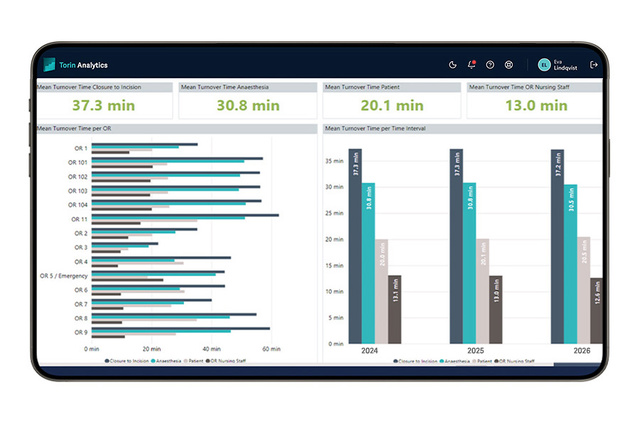
Understand what drives delays and not just how long they are
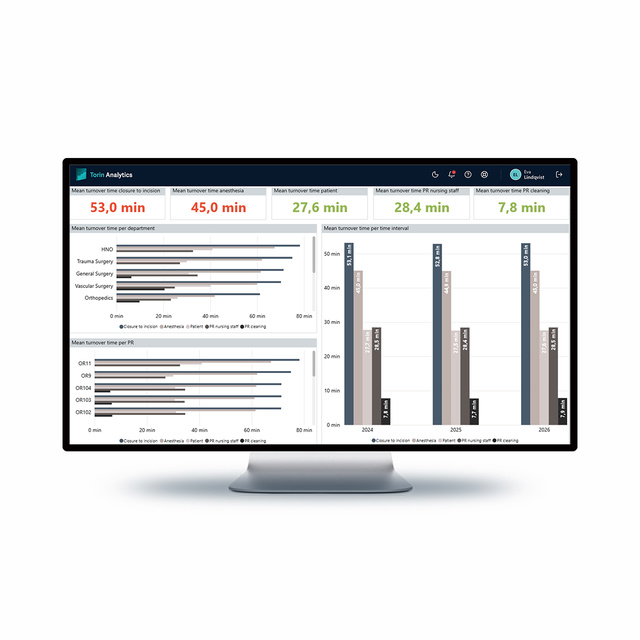
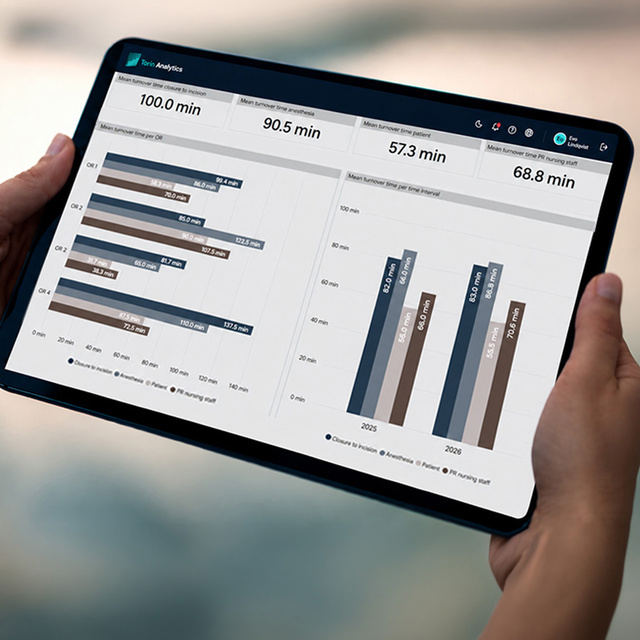
Break down the time between consecutive surgical cases to understand where delays occur. Explore the different phases, including anesthesia, nursing and cleaning, to identify recurring patterns.
- View by department, room and over time
- Compare turnover performance across rooms and time periods
- Support more targeted, room-level improvement
Where are delays happening during surgery?
Focus improvement where it truly matters
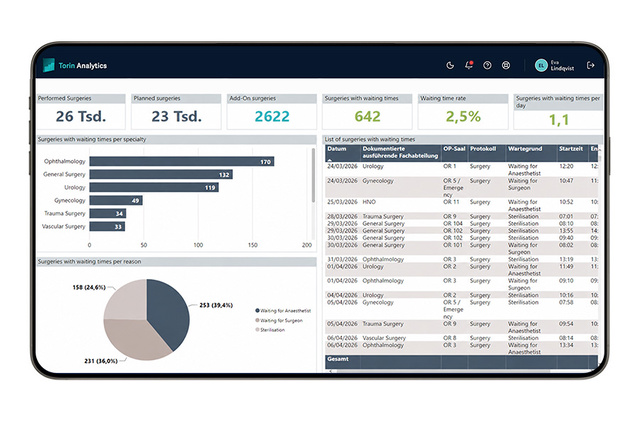
Explore waiting times during procedures, including how many surgeries are affected, the documented reasons and which specialties experience the most disruption. Color-coded rates help identify areas that may need further attention.
- Breakdown by specialty and reason for waiting
- Drill down to individual case level
- Track whether interventions are reducing wait frequency over time
Why do first-case delays keep repeating?
Identify recurring delay patterns
Compare planned and actual first-case start times to identify recurring patterns across rooms and time periods. Explore on-time performance and delays to understand where targeted action may be needed.
- Mean delay and on-time rate at a glance, with built-in data quality scoring
- Breakdown by specialty, room, procedure type and time period
- Drill from yearly trends down to hourly views
Operational insights powered by business intelligence
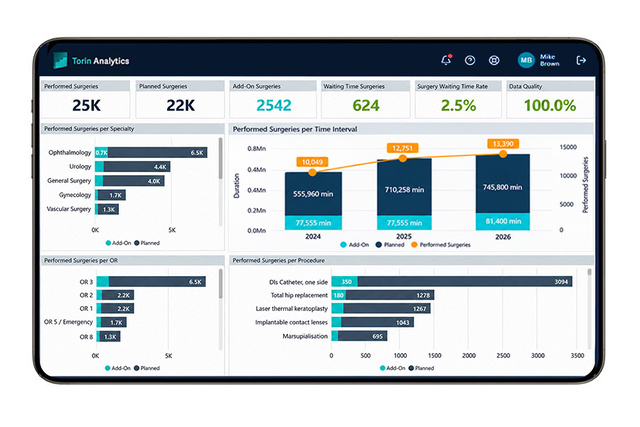
Torin Analytics connects the data your hospital already captures and turns it into a clear view of your surgical department’s performance. Utilization, turnover, delays and on-time starts in one place, broken down by room, specialty and procedure.
- See where capacity is hiding
- Understand what’s driving inefficiency
- Act on insights and track the impact
You focus on care. We handle everything else.
Cloud software, delivered and managed as a service.
Built for the Cloud
Up to date,
nothing for you to maintain
- Live from day one, via your web browser
- Continuous feature updates
- No servers, no IT burden
- One platform across all sites
Subscription-based
Pay as you operate, scale as you grow
- Operating cost, not capital
- One bundled subscription
- Scale up, no re-procurement
- Compliance & validation maintained
Uninterrupted care
Always on,
always supported
- 99.8% guaranteed uptime
- 24/7 proactive monitoring & support
- Managed updates & security
- Automated, tested backups
Backed by Service Level Agreements (SLA) across availability, response, security and recovery

Protecting your data at every layer
Security is integrated throughout our digital solutions — from development and threat management to privacy, encryption and ongoing protection.
- Secure by design with automated security checks, secure coding and continuous review
- Proactive threat management with early threat modelling, penetration testing and continuous vulnerability remediation
- ISO 27001 and ISO 27701 compliance supporting information security and privacy management
- GDPR and HIPAA support for data protection and privacy requirements
- Strong encryption helping protect the confidentiality and integrity of your data