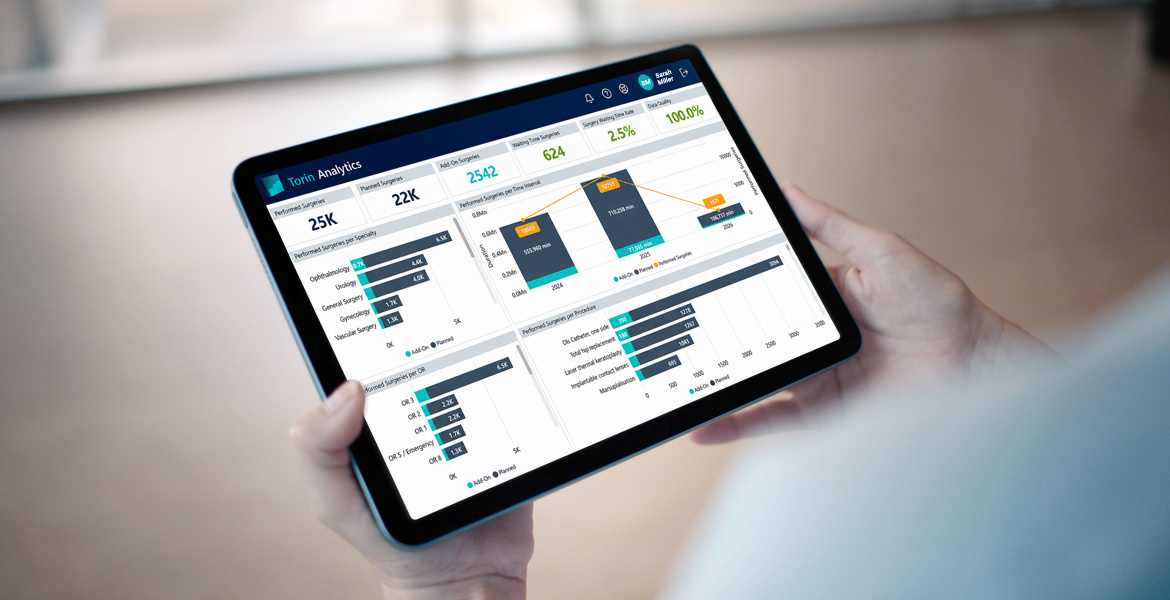
Operating rooms generate a wealth of performance data, from first-case start times to the turnover between cases. Turnover time alone is one of the most studied measures of OR efficiency[1]. But data only makes a difference when teams understand what lies behind the numbers. This article looks at how hospitals have used their own OR data to find the causes of delays, what changed as a result, and what it takes to turn that data into lasting improvement.
What changed when hospitals acted on their own data
Why operating room efficiency metrics need to be seen together
The operating room is a complex, high-cost system [1] and a key driver of hospital revenue [2]. It is also closely tied to the services around it. When recovery beds are unavailable, patients are held in the OR [4], and an inefficient preoperative process can delay the first case and disrupt patient flow for the rest of the day [5].
Measuring that performance is not simple, as no single metric fully captures OR efficiency[1]. Turnover time is among the most studied measures, and research on it alone spans 136 analyses across 105 studies[1]. Each metric tells only part of the story; the full picture emerges when they are seen together.
Finding the root causes of OR delays in performance data
In both case studies, the teams started by analyzing their own data before making changes [2][3]. At an ambulatory surgical center where only 30% of first cases started on time, a Lean Six Sigma team examined 888 cases over 20 months, traced the root causes of delays, and introduced five targeted changes [2]. Twelve months later, on-time starts had reached 79%, and minutes lost to delays had fallen by about 49% [2]. The authors credit this diagnostic work with laying the foundation for the changes that followed [2].
At the Atlanta Veterans Affairs Health Care System, a general surgery team combined a turnover dashboard with direct observation, process mapping, and cause-and-effect analysis [3]. They found that delays came from late-arriving cleaning staff and low staff awareness of turnover time [3].
More broadly, a 2025 review of 105 studies mapped the factors hospitals can change, from anesthetic approach and communication to staffing and room setup [1]. Running tasks in parallel and team dynamics were among the most effective areas [1].
How OR data improved turnover time and first-case on-time starts
In Atlanta, one of the changes was a new process that alerts cleaning staff five minutes before a case ends [3]. Average turnover time fell from 74.5 to 52.7 minutes, improved to 48.1 minutes between May and September 2023, and reached 37.0 minutes across all surgical specialties by June 2024 [3]. The team estimated savings of $663,300 over 11 months [3].
A 2020 review of 39 lean interventions in inpatient care, 21 of them in operating rooms or surgical units, found that on-time starts improved in all seven studies that measured them [5]. Turnover time fell in six of the eight studies that measured it [5]. Every study that improved on-time starts or turnover time used a team drawn from several professions [5].
The Atlanta experience shows why. The biggest early barrier to change was not the process but team dynamics[3]. Through biweekly meetings, the OR team learned to listen actively, communicate effectively and put new processes into practice, while staff were continually reminded of why turnover time mattered[3].
What this means for OR managers and surgical leaders?
For those responsible for OR operations, the lessons are practical. Both case studies started with the hospital’s own data rather than a ready-made fix[2][3]. Making that data visible matters too: the lean review identifies visual displays and short daily meetings as structures leaders should put in place[5]. In Atlanta, for example, the team displayed current turnover times on a board near the staff break room[3].
The evidence has limits. None of the 39 lean interventions was tested in a randomized trial, and only about 15% tracked results for more than a year[5].
The first step is simple: bring OR data together, find the causes behind the numbers, and share the results with the teams who can act on them.
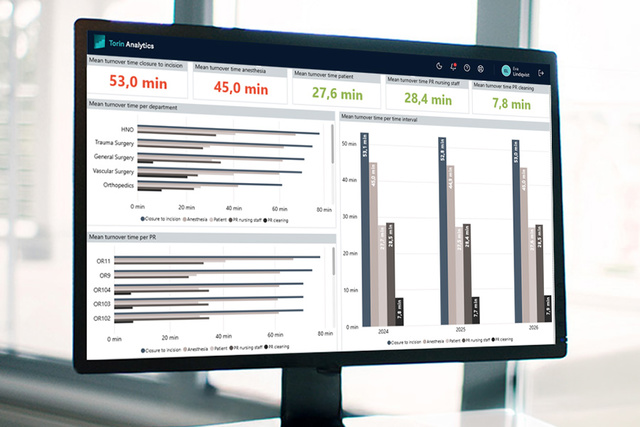
Torin Analytics
Turn operational data into informed decisions
Bring your OR data together with Business Intelligence for a clear view of performance, capacity and trends. Torin Analytics helps you identify inefficiencies and make better use of time and resources across your surgical department.
Understand your OR performance to drive efficiency:
- See utilization, capacity and key performance trends
- Identify delays, variation and opportunities to target improvement efforts
- Track performance to support surgical planning and resource allocation